.png?width=2000&name=SDG%20-%20Logo%20White%20(1).png)

In our first story, we introduced Databricks’ Data Intelligent Platform and all its features that enable facilities to build a more than proficient ML end-to-end architecture. After reading the first article, you should have a clear vision of why Databricks extracts the best of Data Warehouses and Data Lakes to build the foundations of new Lakehouses.
We also explored the Unity Catalog, a place to store everything in just one place, making our lives easier (like a perfect and clean wardrobe for Data Engineers). Finally, we studied the main features of the Delta Lake and how it is applied to Delta Tables and Delta Live Tables; in addition to various protocols inherited from the Delta open source storage layer (such as the Delta Logs, Delta Sharing Protocol & Delta Engine).
Given this introduction, it is time to go further in our way to dominate the new data architecture realm provided by Databricks. Next stop; the Data Science Workspaces & Workflows.
.png?width=700&height=394&name=1%20(1).png)
1. Data Science Workspaces: The developers’ playground
Databricks’ Workspaces solution is a cloud-based hub designed to revolutionize the way teams collaborate on big data analytics and machine learning projects. Workspaces can be pictured as a digital canvas where data engineers, data scientists, and analysts come together seamlessly.
Databricks Workspaces stands out for its ability to integrate with major big data and machine learning frameworks. It’s not just a tool, it’s an environment where teams can collaborate in real time. Notebooks play a pivotal role, allowing users to blend live code, equations, visualizations, and narrative text for shared development and collaborative problem-solving. Notebooks include features for auto-completion of code, automatic formatting for Python and SQL, tracking of changes (version control), and also, generation of code using Generate AI.
.png?width=700&height=394&name=2%20(2).png)
Next, we will explore the main Workspaces capabilities:
a. Shared repositories and integration with Git: Thanks to a visual API, Databricks facilitates the usage of repositories for small to big development teams. All git common operations (such as pull, push, commit, merge, etc.) can be achieved using a visual interface. Git folders are backed up by common git providers that can be cloud-based server solutions or on-premises. The git integration is usually pretty smooth with the usage of PAT (personal access tokens). In upcoming articles, we will take a look at the CI/CD pipelines and we’ll explain how to work between git environments to achieve an integration pipeline from development to production.
b. ML/DS libraries: As we mentioned before, the notebook is the main tool to develop the whole machine learning solution. From data processing pipelines to model exploration, the usage of notebooks is almost mandatory across Databricks’ Catalog. Notebooks come with the most used Python libraries for Data Science thanks to Databricks Runtime ML. Without the need to create virtual environments and install all these libraries, we’re already able to import matplotlib, sci-kit learn, or Keras. Also, notebooks can install libraries using pip. Databricks Runtime ML clusters also include pre-configured GPU support with drivers. It also supports libraries like Ray to parallelize compute processing for scaling ML workflows and AI applications. Not to mention that libraries like Hugging Face Transformers and Langchain are also included to support LLM solutions.
c. Visualization tools: Databricks provides two different main visualization workflows/tools: Data profiles & Visualization.
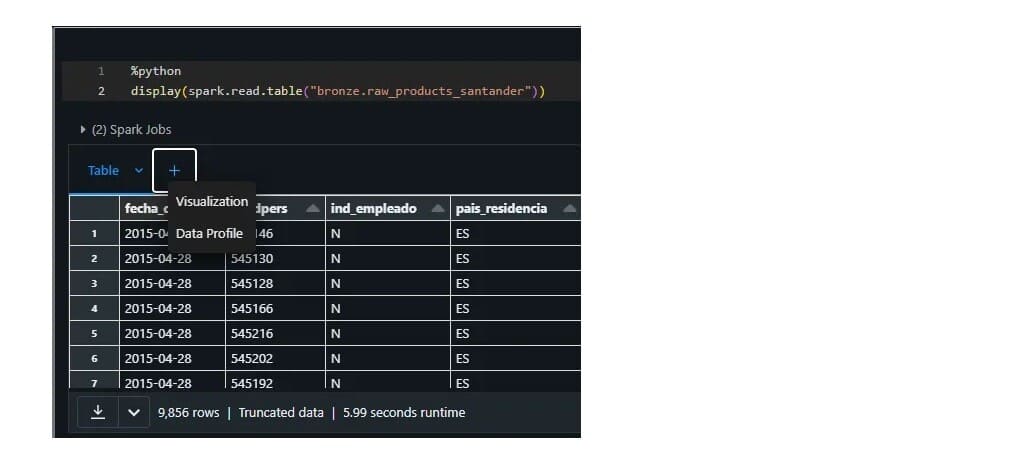
Data profiles. These are data exploration pages where the developers can display summary statistics of tables stored in Databricks’ Catalog. These profiles provide a wealth of information, including data distribution, data types, summary statistics, missing values, and unique values for each column in your dataset. By examining these metrics, you can quickly identify data patterns, anomalies, and potential issues that may require further investigation or cleaning. These profiles are highly interactive; this interactive approach makes it easier to spot trends, outliers, and data inconsistencies, empowering users to take action to address them.

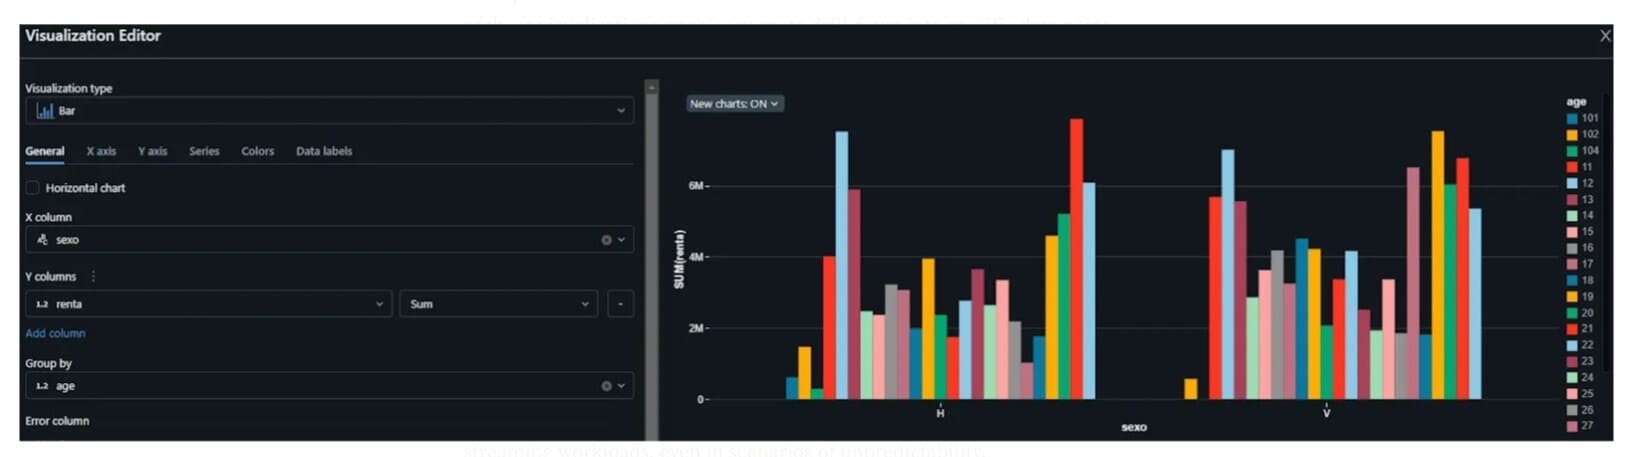
Visualizations. Regarding the second tool, visualizations are non-code built-in tools in notebooks to visualize tables. This is a very interactive and intuitive tool that provides users with a quick way to analyze their data, for example, to find data outliers, trends, or correlations. The interactive nature of these visualizations enables users to drill down into specific data points, filter data dynamically, and customize the appearance of their charts for better clarity and understanding.
2. Databricks Workflows: Jobs
Jobs ensure seamless execution of workflows for orchestrating different activities. This is the backbone of executing tasks at scale and orchestrating the entire ML and data lifecycle. Delta Live Tables, combined with Jobs, provides enhanced autoscaling, efficiently handling both batch and streaming workloads, even in scenarios of unpredictability.
Databricks Workspace, Delta Live Tables, and Jobs collaborate to create a symphony of ML architecture integration. Databricks’ Data Intelligent Platform enhances the ML solution integration of data workflows, making it a tool for organizations seeking efficiency and scalability in their data-driven initiatives.

Jobs are built under the most common features an orchestrator usually has. These features answer the following questions: What? How? When? Who?
- What? Jobs can trigger multiple different tasks, from notebooks to Python scripts, SQL, DBT jobs, DLTs, or even other Jobs. Before configuring a job, we should figure it out and schematize “What’s” going to be executed. In addition to the job type, usual fields such as the job name, tags, or notifications can also be edited.

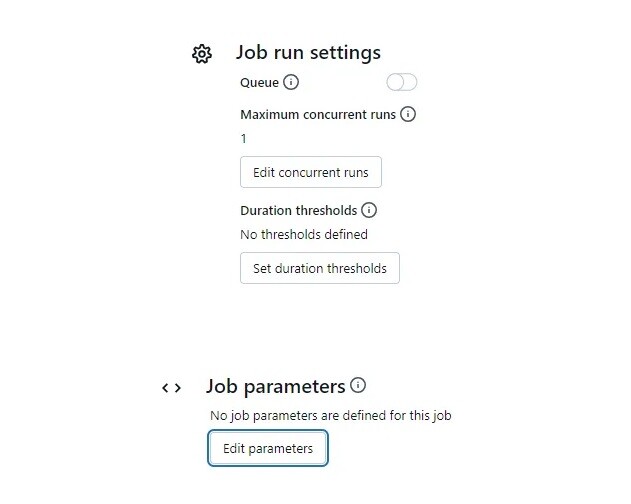
- How? It is a good practice to establish some limits or “parameters” to our jobs. How many retries? How many concurrence jobs? How much “max” time our job be running?
- When? Configuring a job does not determine when this job is going to run. Without a scheduler, a job is like setting up a gourmet meal in the kitchen and forgetting to turn on the oven. Please tell the job when to run or when to be triggered…

- Who? Not everyone should be accessing our defined tasks. All platforms manage their access control and in Databricks this is managed easily under the job configuration page as well.

In the following section, Jobs in Databricks Workflows will serve as a roadmap for our journey through data processing and insights derivation. The following figure shows an example of an end-to-end ML solution we have developed using four jobs for the following common ML activities for a use case of product recommendation. The activities we have automated using jobs are: (i) data ingestion and preparation, (ii) use case preparation, (iii) model training, and (iv) model inference.

Job 1: Data Ingestion & Preparation
The first job is the one in charge of making the data ingestion and preparation activities. This job will lead us to the realm of Delta Live Tables, a dynamic component facilitating the orchestration of tasks. Delta Live Tables not only manages the flow of data between Delta tables but also simplifies the intricate dance of ETL development and management. This enhanced feature streamlines data tasks and offers a declarative pipeline development approach.
Delta Live Tables will have their own story in the following articles. For now, we will figure out this step as a black box where our data is magically cleaned and get ready for our use case. Just an appetizer to the article that will come, the steps needed in this job are the required for the medallion layers generation.
a. Data Ingestion:Initiated by importing data from diverse sources into the workspace. Databricks’ Auto Loader enables the possibility of ingesting data through cloud storage seamlessly.

b. Data Preparation:It refines and structures data for analysis and model training. As we said before, we’ll build our layers using DLTs. With DLTs, in just a few steps we can clean up and get our data ready for the following use cases to come. It is in this DLT where we will apply the data quality rules, start to fill the feature store, and in general terms make our data ready for all possible use cases (Stay tuned to see more about this step in incoming articles!).

Job 2: Use case data preparation
The second job is the one in charge of making the data preparation for the use case. Let’s agree that at this point we have all our data curated and cleaned by the previous job. It is our responsibility here to provide functions to operate over the data for our specific use case. We will exemplify that with a use case for “Product Recommendation”.
Before this step we should have done our Model Exploration, supporting ourselves in the Databricks’ workspace enhancements for ML/AI. Leverage Databricks’ MLlib and integrate with popular frameworks to construct machine learning models.

Once we’ve completed our model exploration, the goal of this job is to accommodate our data to the model input requirements. As you can see in the screenshot, we’re calling again a notebook. Inside this notebook, we extract the data coming out of the Gold Layer and proceed to:
- Feature engineering: In some use cases, we may need to accommodate our data, and operations such as time shifting or target variable engineering are common in this step.
- Feature selection: We will cherry-pick our most preferred features from the feature store. Also, indeed, we’ve already extracted some features from our previous DLT Job. But this time we could extract very specific features that wouldn’t make sense for any other use case.
Job 3: Model training
As a next step, we will train models and evaluate their performance using diverse metrics. Databricks’ MLflow integration allows us to store every run seamlessly. Stay tuned to the following articles to see more about Model Governance!

This job is in charge of model training, and it can be used to “re-train” our model before any possible deployment to production. In this job, we can set how often we would like to retrain our model. Since our use case for product recommendations can vary considerably depending on the month we’re in, it makes sense to schedule this job monthly. As you can see, we’re triggering another notebook. This notebook contains the necessary scripts to process our training data and give us a new model ready to infer new predictions. For our specific use case, we should train our model with the same months as the previous year. In this job, we could configure some parameters to provide our model with a more “automatic” feeling. This could be, for example, the current month, so our job automatically selects the dates concerning the incoming inference needed.

Putting everything in one place. Once our model training job is set up, we’re ready to put everything together. We’ll configure one unique pipeline where we have extracted our data, processed it in the first job using DLTs, then applied the required modification for the model in the second job and trained our model in the last one.


Job 4: Model inference
We're now ready to infer new predictions. As we indicated before, what we will do now is to put all jobs together to create a unique pipeline that can be triggered each month to give the predictions for the following month.

Similar to the model training job, we could make use of job parameters to extract the month where the job is executed and align the model we should be picking from our Model Store.
Conclusions
In this article, we have checked how managing and configuring jobs is very easy. You just need to create a notebook, DLT, or whatever you want, attach it to a new task, and set up the scheduler, permission & parameters. Once everything is done, you’re ready to run your pipelines with a seamless MLOps integration.
This magnificent usability, in addition to the workspace integration features, made our lives easier for exploring and transforming our data. We also saw some snippets of the incoming articles. Stay tuned for the next episodes; where we’ll deep dive into Delta Live Tables, CI/CD workflows, Model Governance, and more!
References
Databricks. (2023, October 12) Delta Live Tables Guide. Retrieved from https://docs.databricks.com/en/delta-live-tables/index.html
Databricks. (2023, October). The Big Book of MLOps, 2nd Edition. Retrieved from https://www.databricks.com/sites/default/files/2023-10/2023-10-eb-big-book-of-mlops-2nd-edition.pdf
Databricks. (2021, December 7). Introducing Data Profiles in the Databricks Notebook. Retrieved from https://www.databricks.com/blog/2021/12/07/introducing-data-profiles-in-the-databricks-notebook.html
Databricks. (2023, October 10). Visualizations. Retrieved from https://docs.databricks.com/en/visualizations/index.html
Databricks. (2024, February 1). Auto Loader. Retrieved from https://docs.databricks.com/en/ingestion/auto-loader/index.html
Databricks. (2024, February 8). Create and run jobs. Retrieved from https://docs.databricks.com/en/workflows/jobs/create-run-jobs.html
Databricks. (2024, February 8). Workflows. Retrieved from https://docs.databricks.com/en/workflows/index.html
Authors:
- Gonzalo Zabala
Senior Consultant SDG Group
- Ángel Mora
Specialist Lead SDG Group