I follow many sports, but like almost all Italians, I’m particularly interested in football. I do not just watch matches cheering for my favorite team, but I follow them in an analytical way like a real coach, one of the 60 million coaches who are following football matches in Italy.
Not satisfied by the analyzes read in newspapers and specialized sites, I used process mining to make more accurate reflections on the game strategies, thanks to a series of graphical tools and statistical calculation that can facilitate analysis. The same we use at SDG to help companies highlight the way in which processes take place within them, through maps based on objective information that allow us to improve the operational model in a short time.
But back to the Inter-Juventus match. With the same paradigm used in companies, I mapped each action of the game as a key to a specific process. The tracking of single match actions, or the transaction log in process mining, enables us to make a precise data-driven analysis of the game.
Let's analyze the game from the kickoff. Inter was initially trying a methodical transition (from left to the right side of the playing field) while Juve was ready to start on the counterattack as made in the first goal. In the first 10 minutes the possession of the ball was equivalent to Inter, which for more than a quarter of the actions involved more than 6 players (27.78% ball circulation) and in half of the actions made a field change (50% transition index) exploiting most of its player in each action (on average 4.4 players touched the ball in each action - kpi “average event per case”) but never reaching the shot. Juve, on the other hand, was able to defend low and start faster with less than three passes (2.89 events per case) before the solitary actions that led to Dybala's goal and Ronaldo's crossbar.
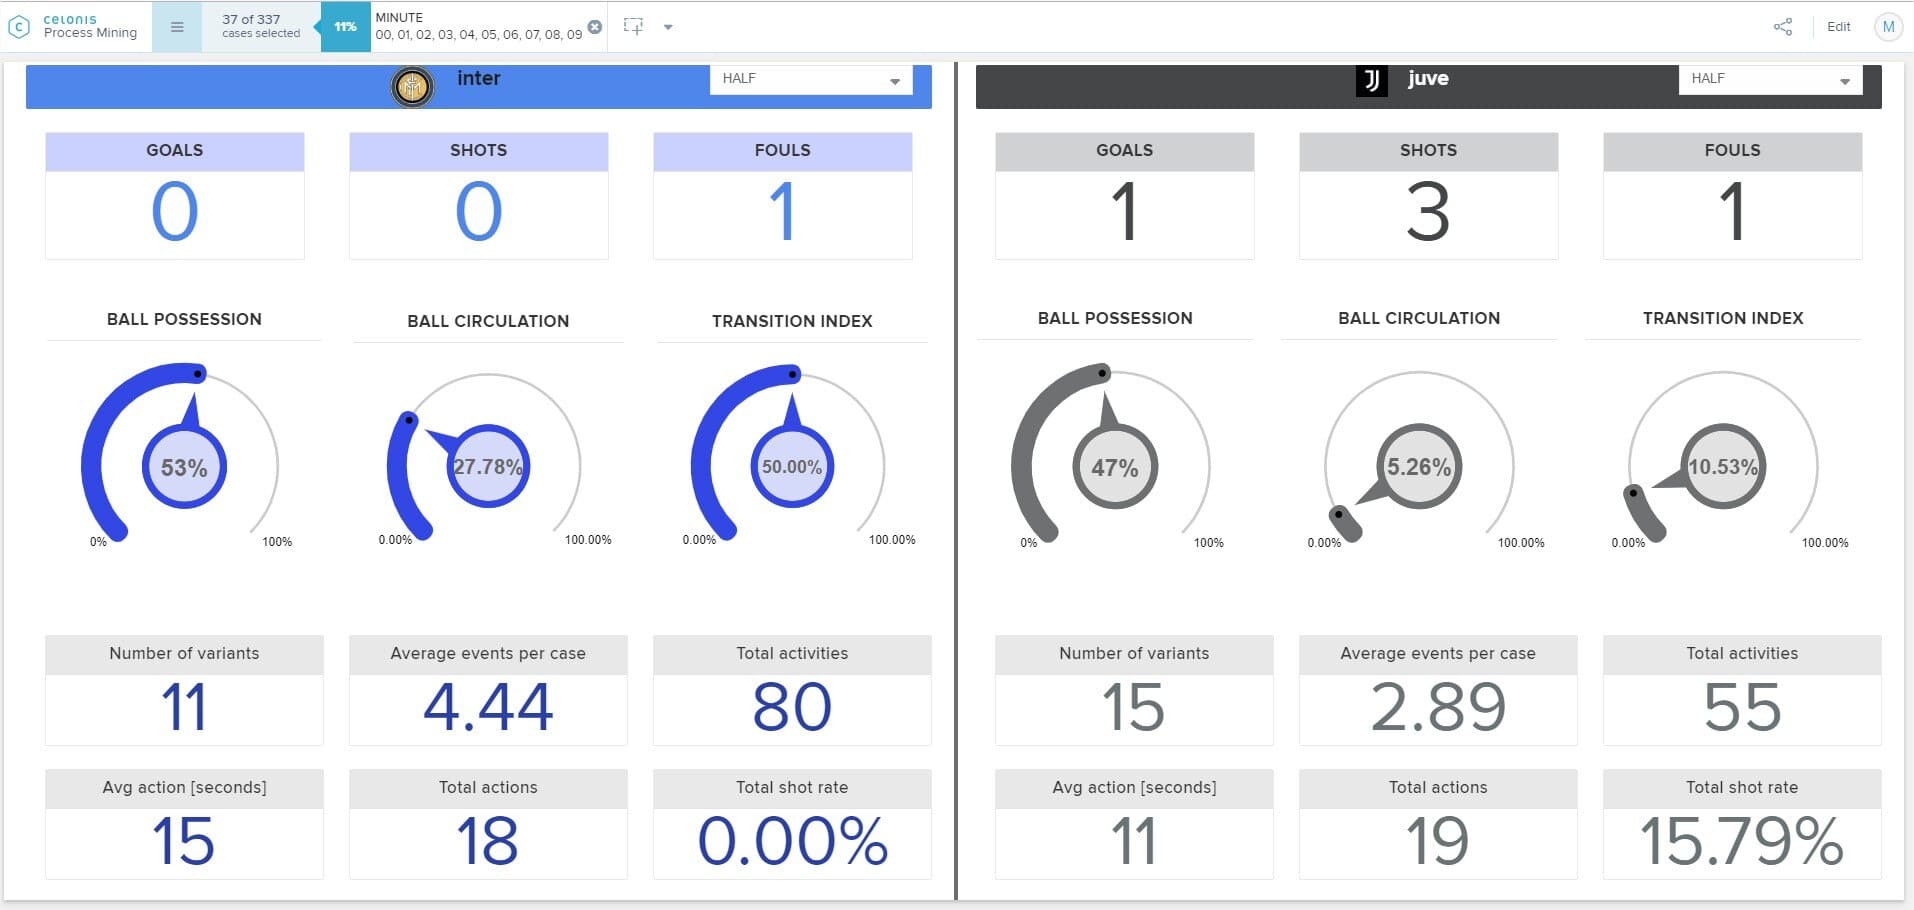
The graph below shows the time per action - the throughput time shown in the colored area (primary axis) - and the number of steps per action (line in secondary axis): Inter did actions lasting about 20" with 8 passages for action on average.
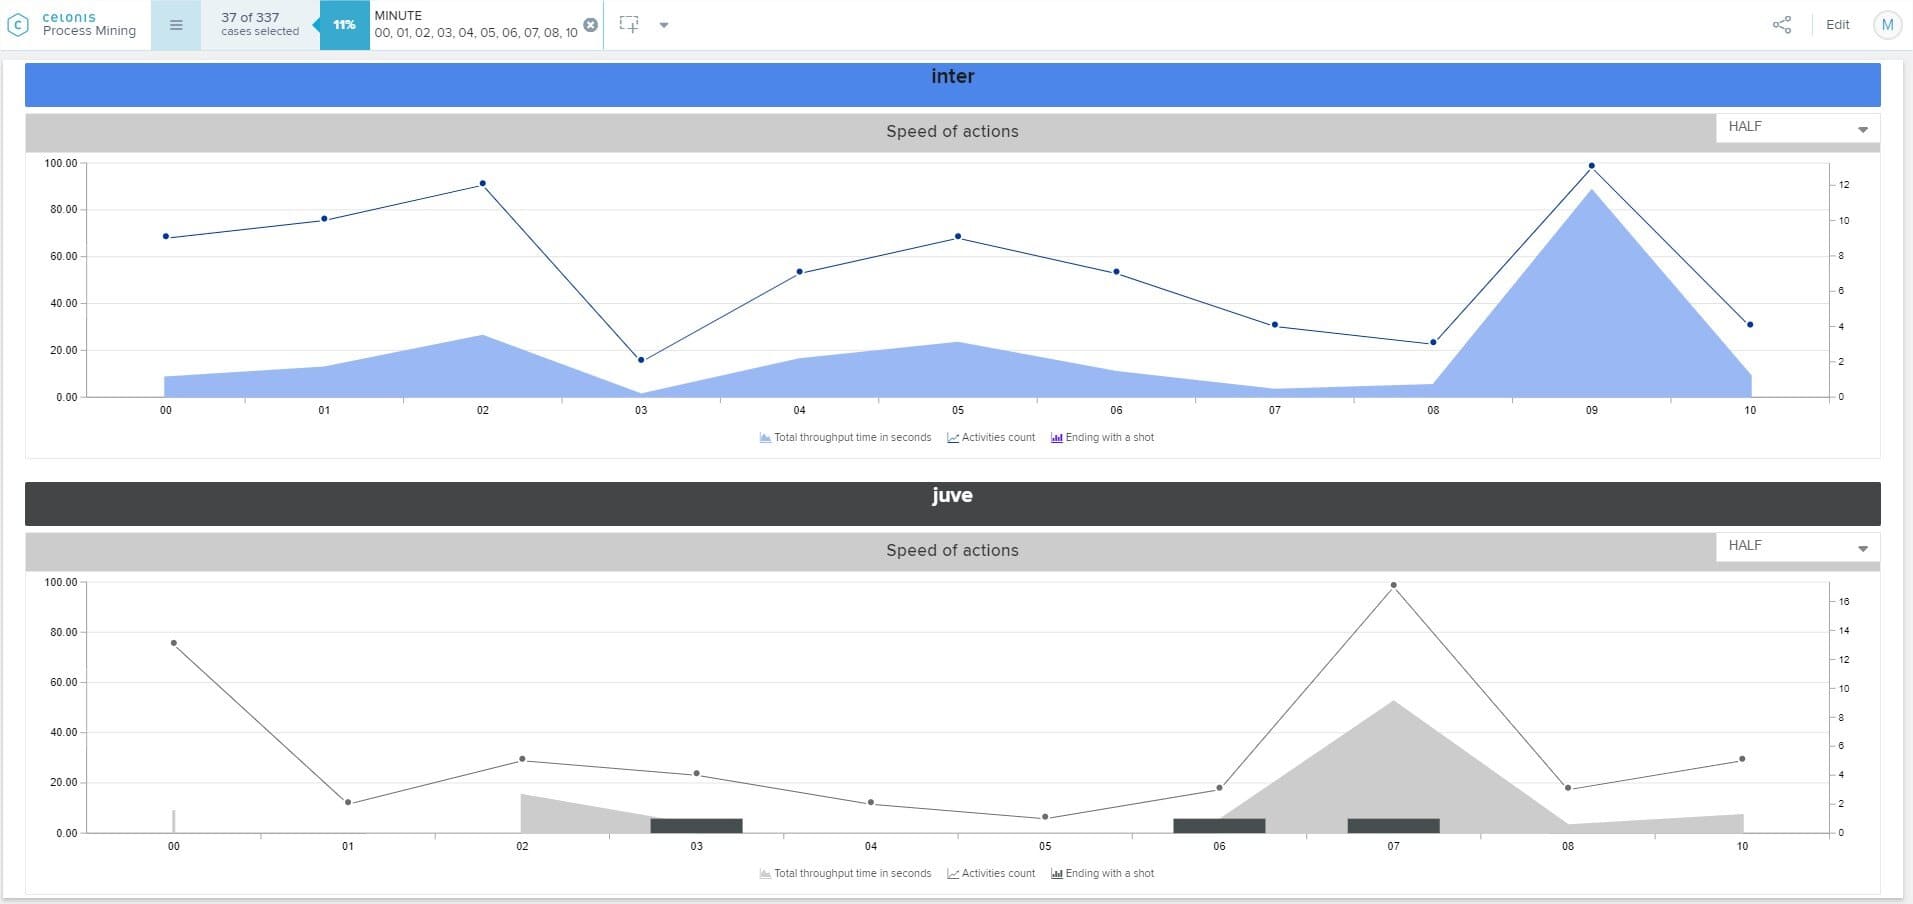
Remaining in the first 10 minutes, all three of Juve's dangerous actions started with a recovered ball and a fast support on the striker who in the 1 vs 1 were able to shoot. In the process flow shown below, the game actions are represented by clean and linear connection lines without useless steps (note: the connection is justified by the fact that Juventus, after the crossbar by Ronaldo has maintained the ball starting a new possession).
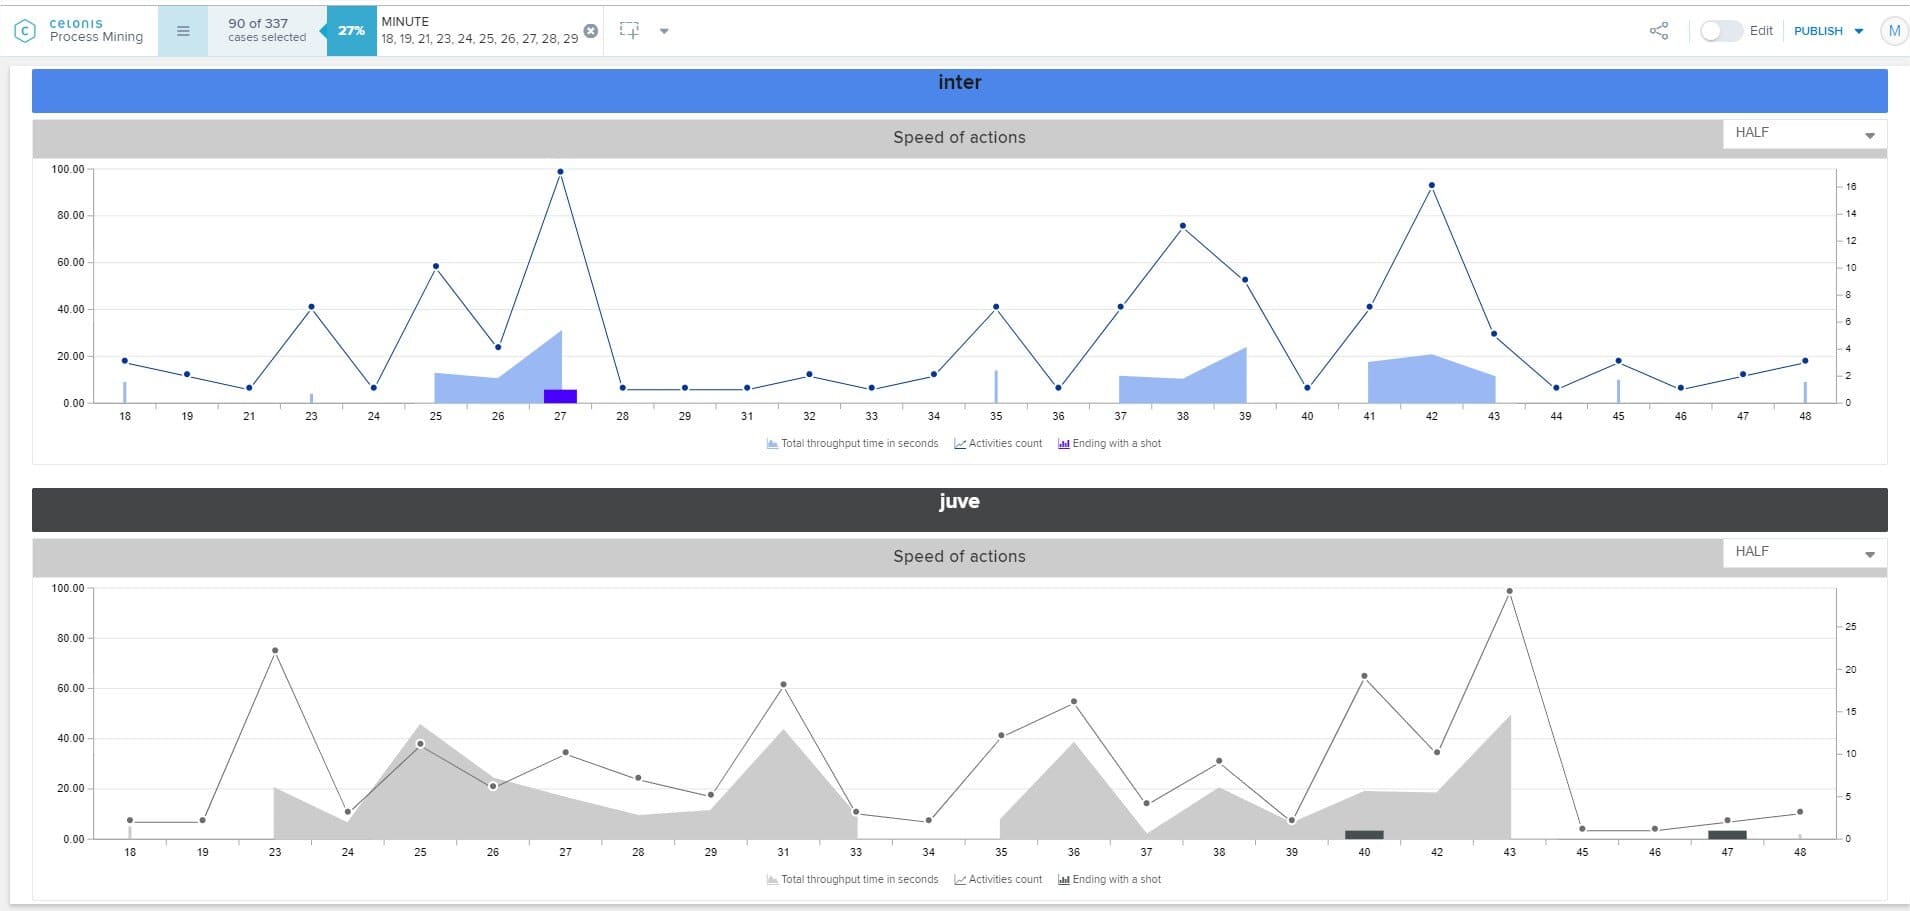
Inter then attacked and managed to draw thanks to a penalty kick (17th minute). From here the game changed: Juve began to beat the pace of the game with excellent passes and an average duration of the action of almost 20" – see figures represented by the average throughput time calculated by Celonis for each action - while Inter tried to rise defense and midfielder with the dribble on rare occasions - as shown by the peaks of the line chart.
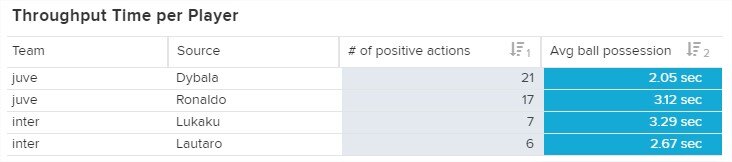
Striker analysis is particularly interesting: throughout the first half, Juve's strikers were more involved in play (action count) and being able to be involved almost twice as the activities count indicator shows, which takes into account every activity performed by the player (passes, shots, recovered balls, etc.)
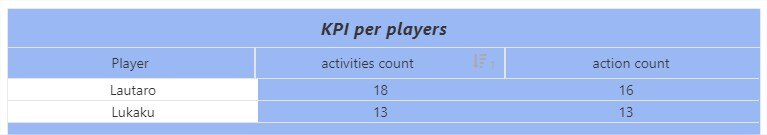
The last KPI which establishes a better performance of Juventus’s striker is the count of the plays for the team, that is a counter of how many positive passages have been carried out: Juventus players are much more incisive with Dybala involved in 21 actions of game in which he has kept ball for just 2.05".
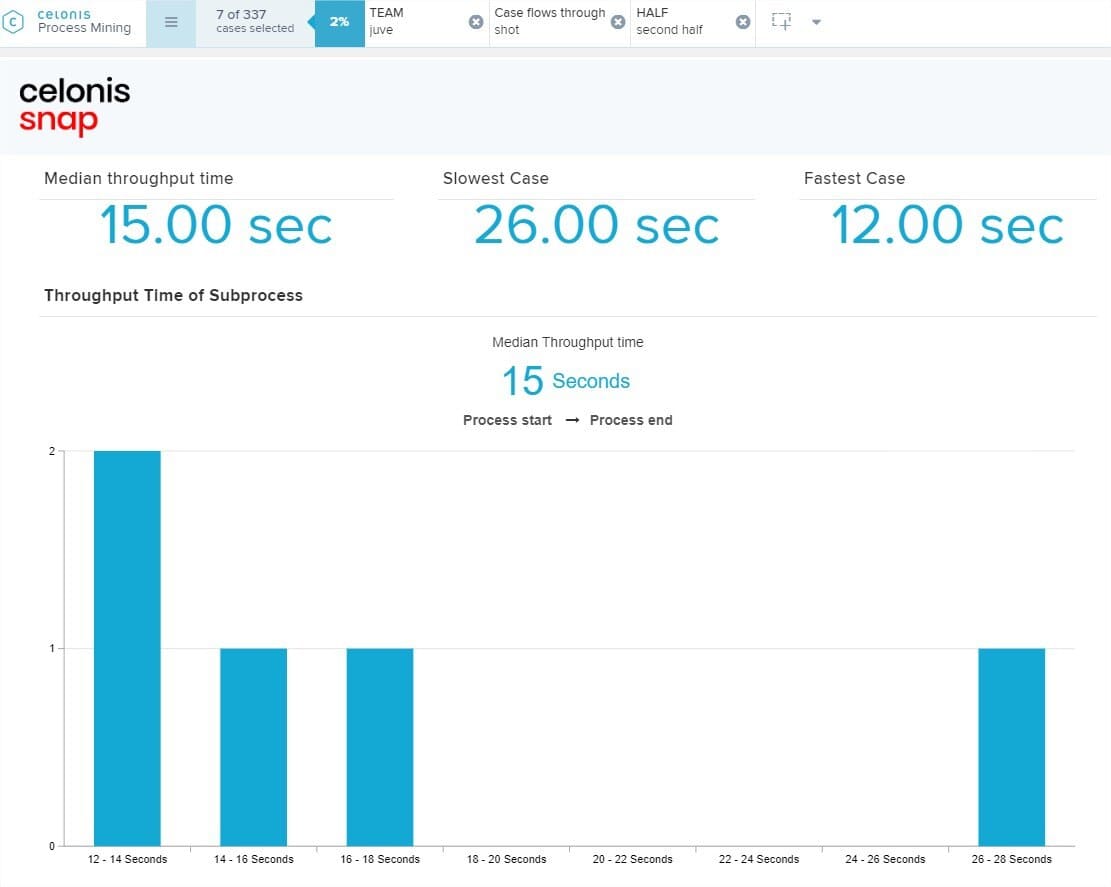
If in the first half the grit and numerical superiority of Conte's midfield has hidden the technical superiority of Juventus, once the rhythms have dropped, the qualitative gap between the two teams has been revealed. In the second half, Juve came to the shooting 5 times and always at the end of maneuvered actions where they made the ball turn. In the following histograms, it is possible to observe the overall distribution with respect to the duration of Juve's actions in the second half and the distribution of the actions that led to a shot.
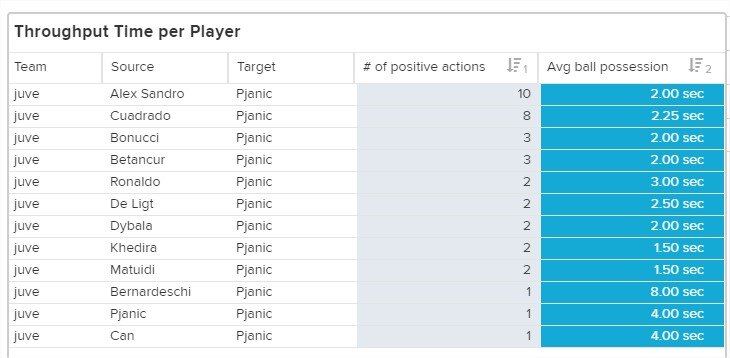
In the second half, Juve's better performance is also demonstrated by the different involvement of the two playmakers: Juventus easily managed to support Pjanic, the team's lighthouse, who quickly sorted the balls received by setting the geometries of the game. The indicators in the following table represent the number of passes made on the same connection (same “route” defined as same passing player and same receiving player) and time before making the pass (Juventus generally faster).

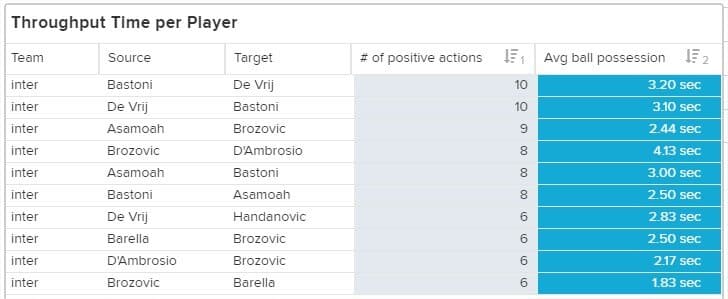
Without filtering on the playmaker but reading the statistically most relevant connections in the Inter pass network, we read a useless ball possession between the defenders: in the first 10 connections for frequency 5 are passages between defenders (even Handanovic enters the standings for having received 6 passages from De Vrij).
And at the end of the match (minute 80), Juve decided to win the game: the action begins with a throw-in by Matuidi and the dense network of passages, represented below by a mini spaghetti view, demonstrates the articulation of the Juventus action that passes for 5 times by Pjanic and 3 times by Betancur, author of the final assist (top left connection in the graph) to Higuain. You can count 24 passes and 10 players involved (everyone except Szczesny) in this marvelous play.

A sport event is the most analogical thing you can describe, and if we are able to use Celonis by creating hundreds of KPIs while watching a football match, imagine what we can do by looking at the transactions of your MES, your accounting, your sales ... your processes!

-1.png)

-1.png)
-1.jpg)