.png?width=2000&name=SDG%20-%20Logo%20White%20(1).png)

1. SAP HANA as a Machine Learning platform
Advanced Analytics are rapidly becoming more and more important as they drive choices in many business scenarios. As explained in detail in this article, the SAP HANA Database can take advantage of the Predictive Analysis Library (PAL), a set of embedded algorithms that can be used to perform advanced and predictive analytics. These combination of IT and Statistics yields to a Machine Learning platform that allows to make decisions with data driven awareness.
In the following we will review some of the main topics that we considered while implementing a time-series forecast project in a real business scenario for a company in the field of food & beverage. The scope of the project was to forecast products demand in order to optimize the production orders and the warehouse stock levels and fulfilled the forecasted sales orders amounts.
2. Advanced Analytics
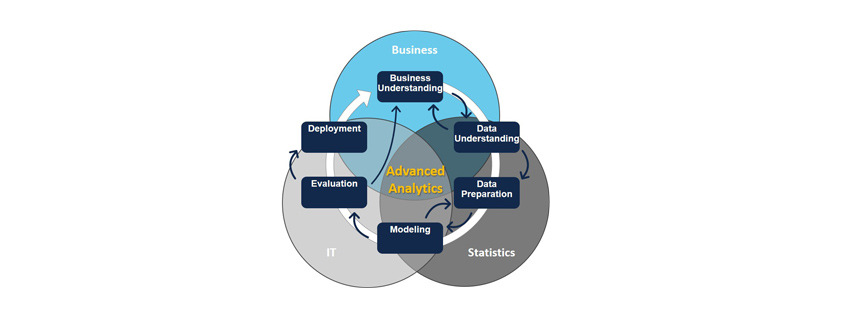
Any Advanced Analytics project should be driven by Business, Statistics and IT. These three spheres provide Validity, Intuition and Automation and should always be considered together in all the phases of the project. The overlapping of these three worlds allow us to develop an application that automates data collection, processing and analysis and can provide Insights.
Consider also that the process is highly iterative: the lessons learned during a phase of the process can trigger new and more focused business questions; subsequent iteration benefits from the experiences of previous ones.
3. Forecast detail and time frame
If we want our forecast to be any worth, we need to be able to say how much volume of a given product, or product category, will be sold to a given customer in the following days, weeks or months.
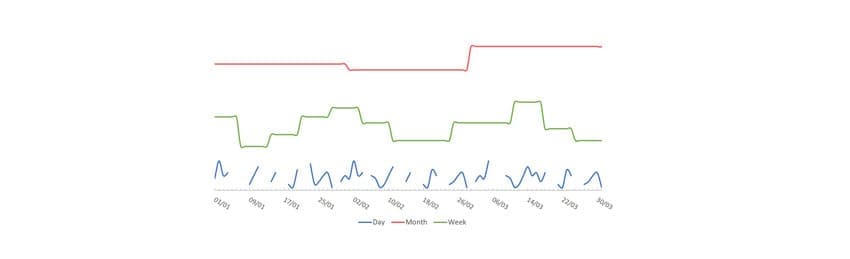
This means that we need to have a time series for each dimension of interest, for example product or product category and customer. These time series will be composed by one value for each period (days, weeks or months). The choice of time frame and level of detail it’s a trade-off between statistics and business.
The Business will be able to benefit from the forecast only if the level of detail and the time frame are suitable to its specific needs. On the other hand, the quality of the forecast highly depends on these choices. As we can see in the chart below, changing the time frame yields to very different trends.
4. Data Preparation
One of the most important tasks is to prepare the data, so that the forecast algorithms can perform at their best. Data preparation techniques are used to hide or highlight features of the dataset.
The choice of which pre-processing to implement, highly depends on both the data and the business application. It is important to define a strategy to identify which time series needs which technique. In the following we present two examples of data preparation techniques.
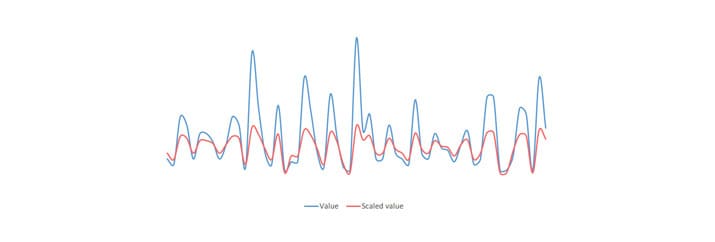
Scaling: time series characterized by large oscillations can be forecasted with more accuracy by scaling their values.
Outliers: some series may contain values much different, bigger or smaller, than the others in the time series, without any seasonal significance. By substituting these values with an upper, or lower, bound, the performance of the statistical algorithm increases.

5. Which is the best algorithm?
The obvious question that one may ask is: how can we choose the right algorithm for each series?
A possible strategy is to test a series with every algorithm, select the best and associate it to the series. This means that we need an approach to define the best. To do so, we split the original dataset in two, Training dataset and Test dataset.

For each series, we forecast the Test dataset using only the Training dataset. The best model is the one that minimizes the error that we can compute, having both Actual (Test Dataset) and Forecast data.

Once the best algorithm has been chosen, we can use it with the whole dataset to execute the forecast.

Previously, we mention multiple times the best but defining what that is it is not an easy task: different error functions can lead to different results. The choice of how to compute the error must be led by both the data features and by the Business requirements.
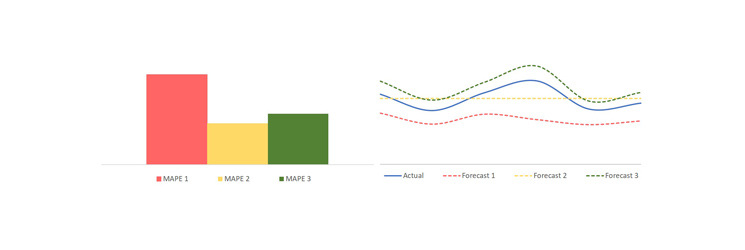
Suppose, for example, that we are using the Mean Absolute Percentage Error (MAPE). The algorithm that generates the lowest error may not represent the best forecast for the business application that we are considering: an average forecast often yields to a lower MAPE, but it does not provide any meaningful trend, which is something that is generally required.
6. Conclusion
These steps are a few examples of the aspects that a Data Scientist needs to consider. The solutions implemented should be driven with both Business and Statistical awareness: the experience of subject matter expert can yield to intuitions that no Machine Learning model is remotely close to obtaining. These intuitions should be translated in statistical language, automated and embedded into the model. This process continues as the statistical knowledge obtained this way can stimulate more Business questions.
The SAP HANA database becomes a platform that allows, through PAL and data management, to automate this process of data acquisition, processing and analysis aimed at generating new information.